The timing and intensity of river ice breakup depends on multiple factors driven by hydrological and meteorological conditions. Breakup may start gradually but can end with a significant ice jam flood. In turn, there are years where most ingredients are gathered for high water levels at breakup, yet Nature decides otherwise, and water levels remain low. The science (or the art) of breakup forecasting is far from infallible, but several tools and indicators exist to inform public services and the population about the annual risk of ice jam floods.
The Climate Change Research team of the YukonU Research Centre is seeking ways to support breakup forecasting, beginning by sharing our observations made during breakup events on ice jam-prone rivers.
***
In the Spring of 2022, river ice breakup was heavily impacted by cool nights that tempered snowmelt runoff, allowing the ice cover to degrade in place. However, the unusually high amount of snow on the ice cover, thicker than usual ice at several locations, and relatively cloudy conditions created unique breakup patterns.
Dawson, May 7, 2022
YukonU researchers gathered with Dawsonites to join in the tradition of watching the ice go out at Dawson. Some ice movements had already been reported upstream and downstream of Dawson, and the Tr’ondëk (Klondike River) had cleared its ice cover a few days earlier. Nonetheless, the ice cover on the Tágà Shäw (Yukon River) in front of downtown looked very strong and it seemed that nothing would make it move soon. At around 6 pm, ice floes (pieces) coming from upstream were seen to flip under the intact ice cover edge and we could hear the noise they made as they collided with the underside of the cover some distance downstream.
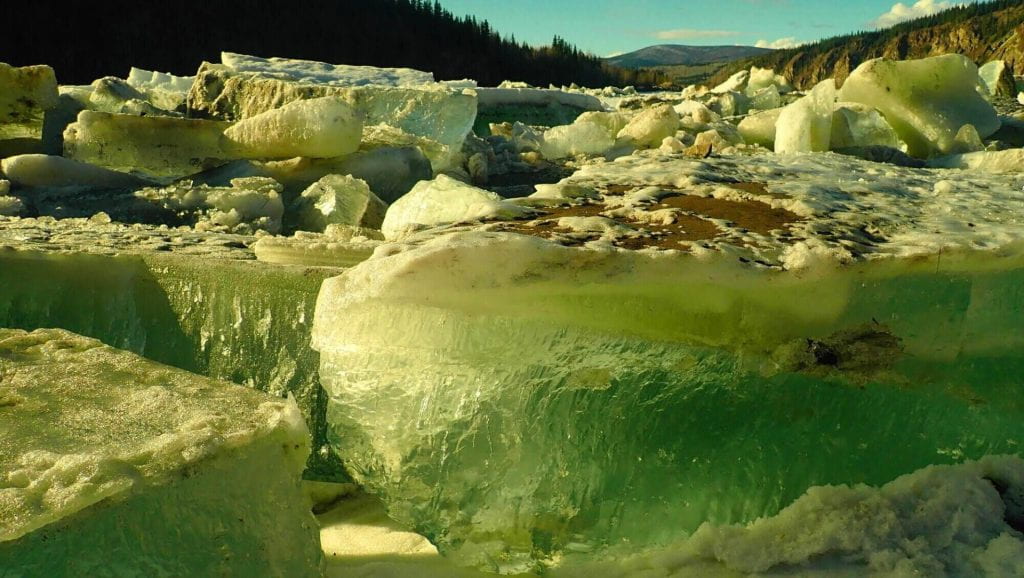
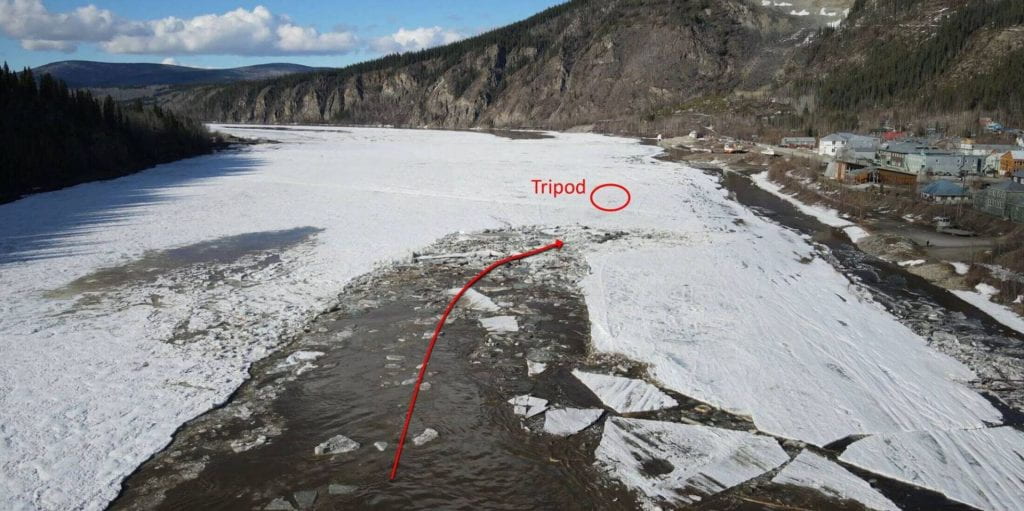
This process created enough instability to cause the progressive formation of a narrow open water channel (50 m-wide, compared with the river width of 280 m) in the downstream direction. Interestingly, the water and incoming ice seemed to chew the intact ice cover, one chunk at the time, while heading straight towards the tripod (actually a quadpod) that stops the breakup clock every spring. Just as the rubble was reaching the tripod (see picture below), a large ice slab on the Dawson side of the river was set free, pivoted, filled the open channel, and got anchored on the bank, therefore ending the chewing process. Everything stopped moving, and again, it seemed that this ice cover arrangement would remain in that state for several days as it looked very strong. People went down to the shore to take pictures of the beautiful transparent ice through which the evening sunlight was shining (see picture above).
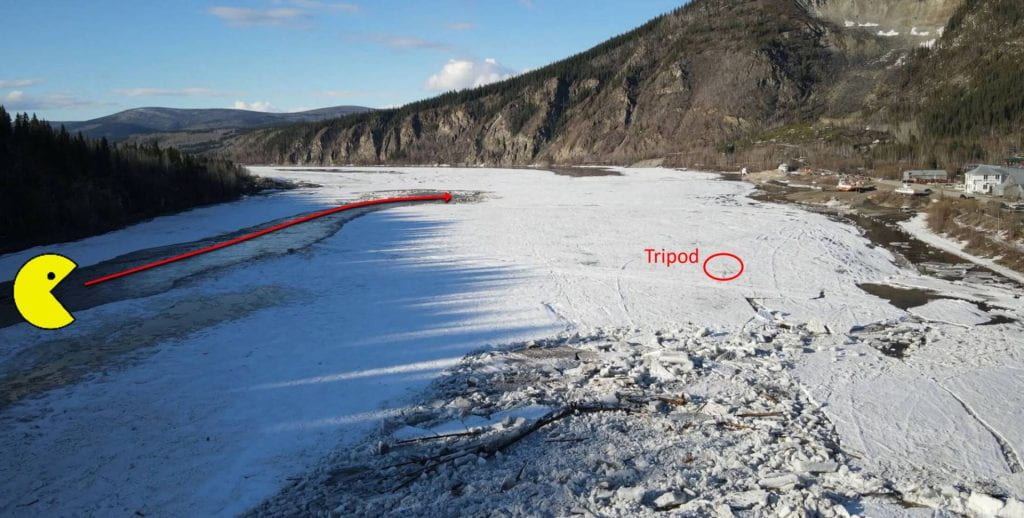
Few people initially noticed that Nature was not done for the day: A new narrow open water channel was progressively forming on the far side of the river in the shadow of West Dawson (see picture below). The same type of chewing process was involved, and we originally proposed that it was a “Pac-Man” type of breakup process. The open channel gradually made its way downstream, and as surprising as the earlier process did, it eventually turned right, plowings through the remainder of the ice bridge and heading towards another strategic target: the Moosehide open water area that had naturally melted during previous days. As soon as the Pac-Man-made channel connected with that open water, it freed up a Dawson-scale ice slab, and the whole ice surface started to move downstream, just like a big cruise ship on its way to Alaska. The tripod was carried, the siren rang, and breakup at Dawson was essentially over. But was it?
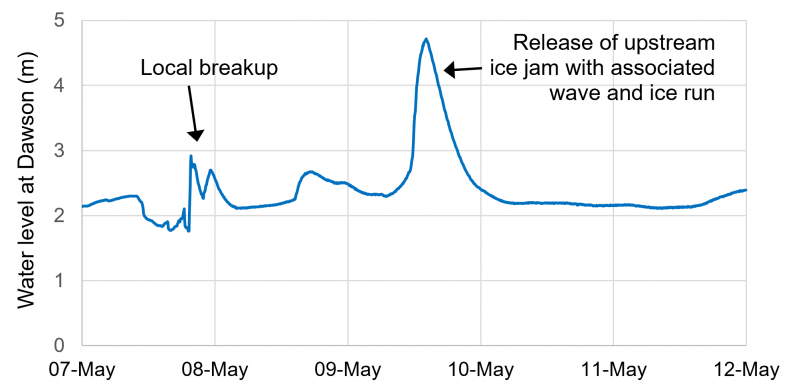
In the morning of May 9, the few ice pieces left on the banks of the Tágà Shäw at Dawson were being pushed into the flow by a bulldozer to prepare for the spring launch of the George Black ferry. At the same time, all the ice stored upstream of Dawson, including ice coming from as far as the Nä`chòo ndek (Stewart River), was released in one significant ice run that caused the water level to rise by 2.4 m over a few hours. This wave would and should have caused the mobilization of the ice cover at Dawson if it had still been in place. A large quantity of ice rubble was left on the bank of the Yukon River (see sequence of photos provided by the Water Survey of Canada below). In turn, most of the intact ice cover on the West Dawson side of the river was crushed and carried. The graph below presents water levels monitored by the Water Survey of Canada at Dawson and clearly shows this large ice-jam-release wave of May 9.

Old Crow, May 15
Despite a colder-than-average month of April, breakup did happen around the usual date this spring on the Ch’oodeenjìk (Porcupine River) in Old Crow. Breakup processes in the Ch’oodeenjìk represent a relative mystery from a western-science perspective because historical data (e.g., satellites products, water levels at different hydrometric stations) have not been carefully analyzed for a couple of decades. After the 1991 ice jam flood, much attention was given to the delta of the Sriinjìk (Bluefish River, 40 km downstream of Old Crow) where overflow ice (icing) forms above and against the ice cover of the Ch’oodeenjìk. This thick ice accumulation represents an obstacle to breakup and therefore an anchor point for ice jams that have the potential to affect Old Crow. In recent years, the Sriinjìk icing did not play a significant role at breakup. However, a satellite image from May 9, 2022 (presented below, from Sentinel 2, false color highlighting water on ice) revealed that a significant amount of water was flowing from the Sriinjìk on top of the Ch’oodeenjìk ice cover. With air temperatures consistently falling below freezing at night and relatively cloudy conditions, this could mean that more icing was forming.
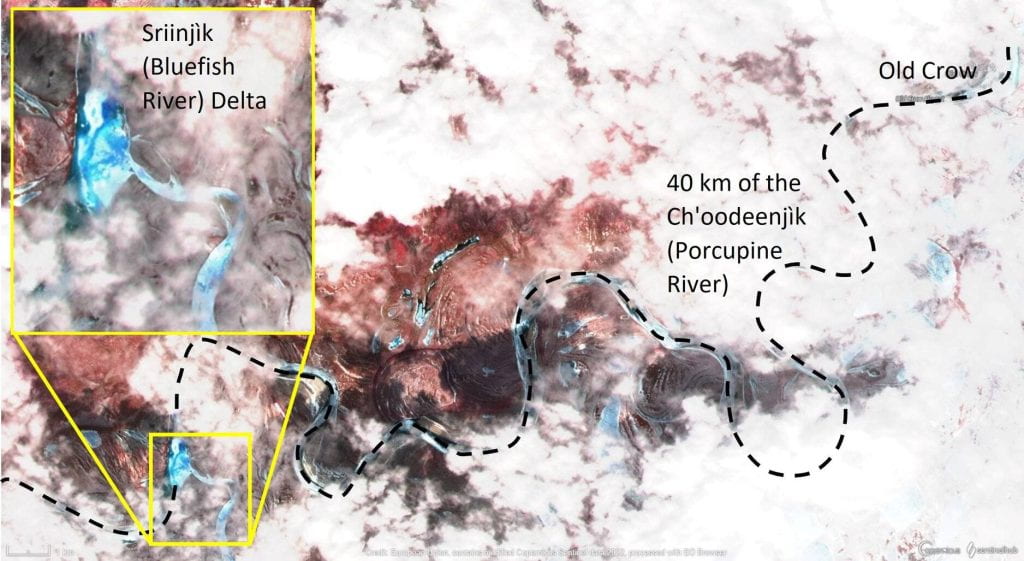
Breakup took place at different locations in subsequent days including at Old Crow, and eventually, an ice jam did form against the Sriinjìk delta (see Sentinel 2 satellite image below from May 14). This ice jam intercepted several ice runs during the following couple of days, and its maximum extent reached more than 30 km in the upstream direction (Water Resources Branch, personal communication), a length that compares with the 1991 ice jam. However, the discharge was relatively low (1600 m3/s, as opposed to 3500 m3/s in 1991), the ice already too weak, and as a result, water levels remained below flooding thresholds in Old Crow.
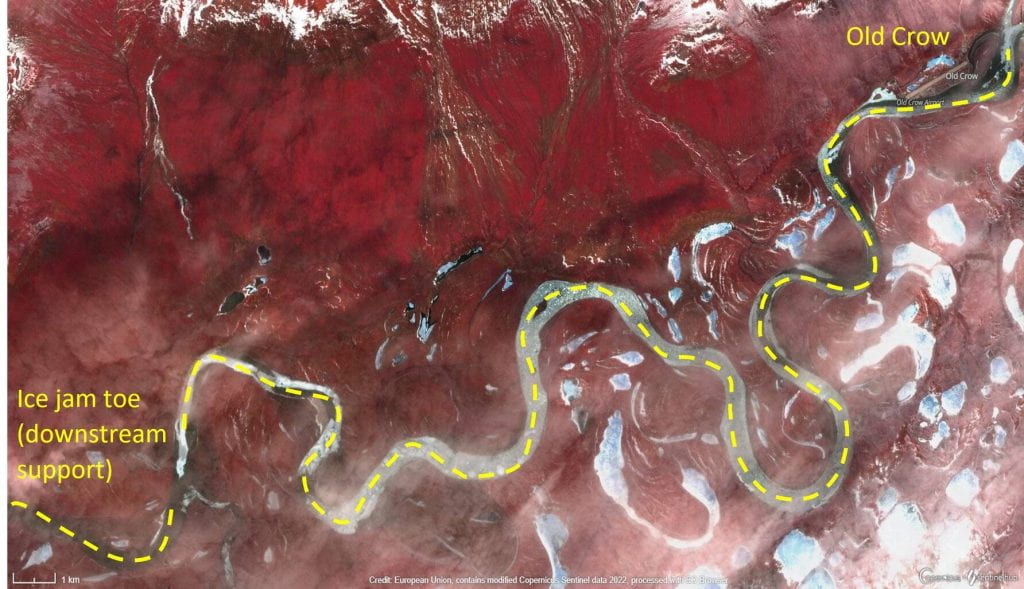
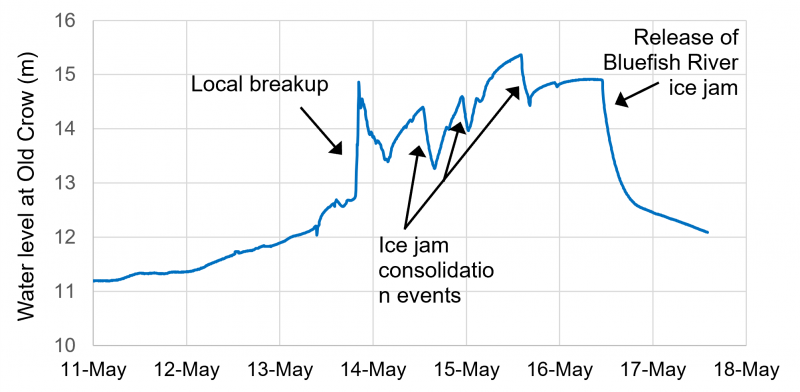
The ice jam released entirely by internal melting (a rare occurrence) on May 16, and the water level in Old Crow dropped by 2.5 m during subsequent hours (this shows how ice jams, even if some distance downstream, may affect river conditions). The graph below presents water level variations measured at the Water Survey of Canada station 09FD003 associated with the formation and release of the jam as well as with ice runs and consolidation events (when the upstream head of the jam respectfully extends upstream or gets pushed downstream).
Other breakup events in the North
Breakup was relatively gentle along most rivers of Yukon in 2022. Some thick ice jams were reported along the Tr’ondëk, especially at Henderson Corner, but this is a typical ice jam location.
A short ice jam of low intensity formed in the Ts’ekínyäk Chú (Pelly River) at Ross River (causing the water level to rise by only 1.2 m) on May 10 as a result of the Ross River breakup, but conditions were not supportive of a significant ice jam flood by then, and the ice accumulation released on the following day.
Hay River, NWT, was hit very hard by an ice jam this year, just like Fort Simpson in 2021. Circle, Alaska, was also affected by an ice jam from the Yukon River.