There is a belief across the North that a delayed spring leads to severe ice jams and spring flooding. Afterall, the spring of 2013, one of the coldest in recent history, was followed by severe ice jams in several Yukon communities. It is true that temperatures cannot remain below average forever, and what people fear is a sudden weather warming, a likely scenario that would cause a fast snowmelt and threatening ice jams.
Should river-side residents be worried about delayed spring conditions?
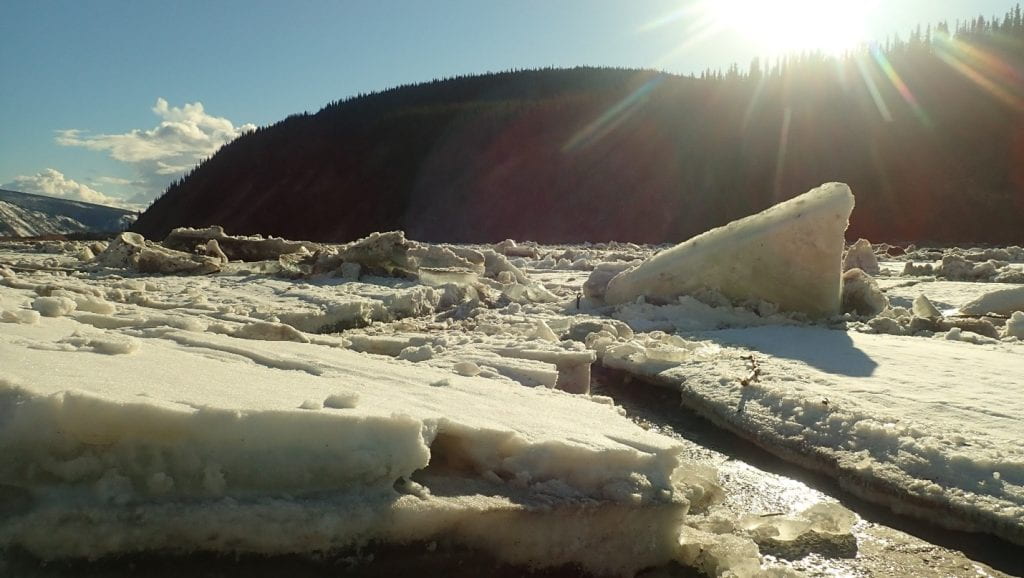
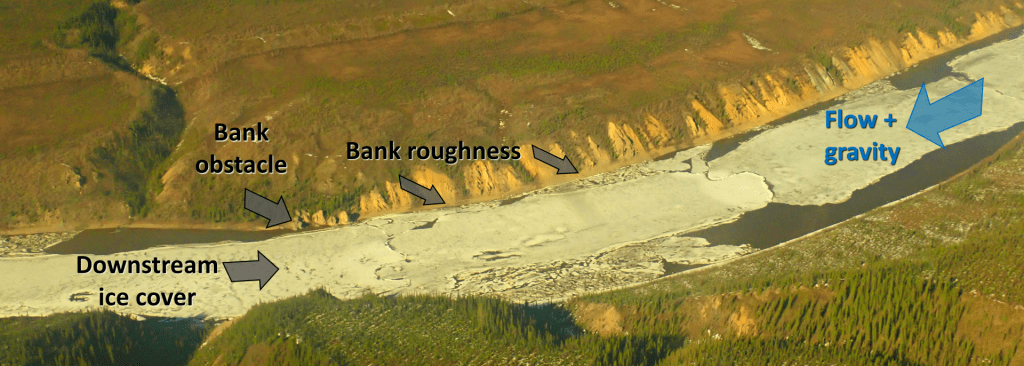
Simply stated, the mobilization of the ice cover on a river begins when the driving forces (mostly associated with an increasing flow and corresponding shear stress under the ice cover) become greater than the local resisting forces (i.e., ice cover strength and ice-bank friction). The figure below illustrates a snapshot of the location and direction of these forces on a fairly large river of the Yukon.
See large ice sheet that has moved under a downstream ice sheet on the right (photo credit: Government of Yukon).
How breakup works
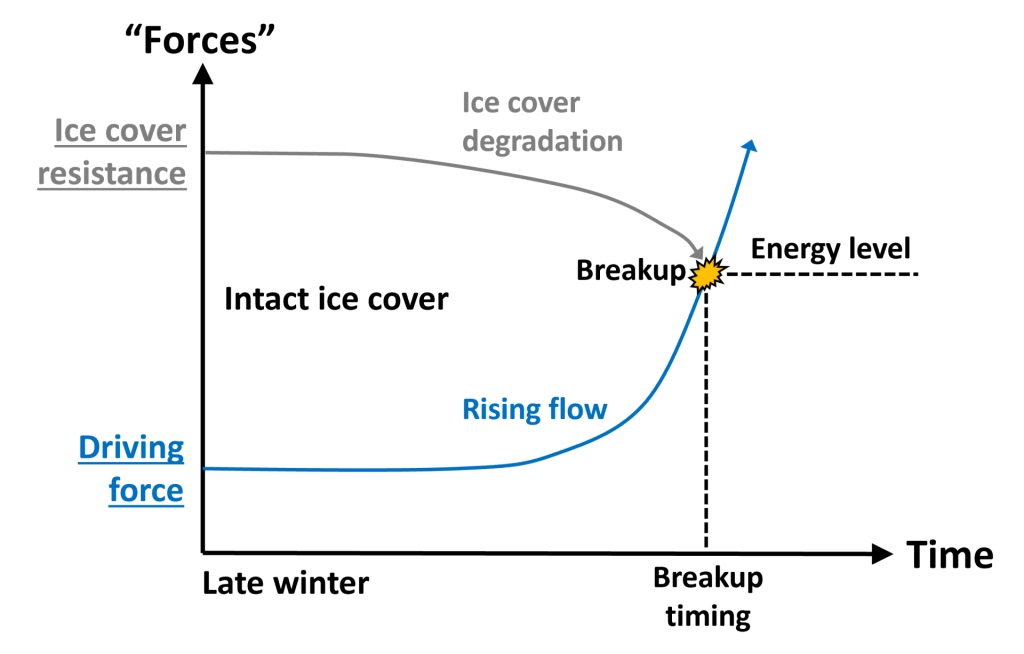
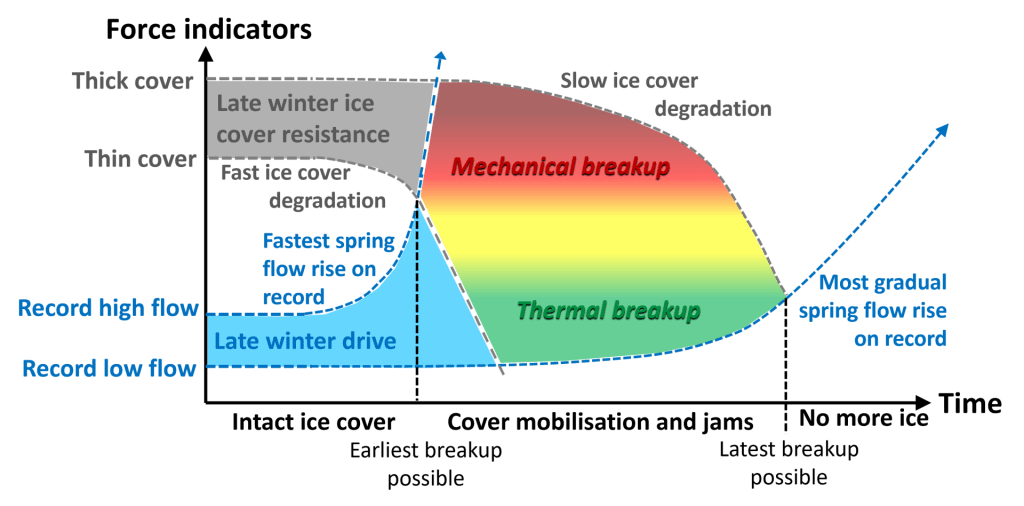
These forces are not constant over time but evolve as breakup progresses. Therefore, the strong, intact ice cover is eventually moved downstream by the increasing flow. The graph below illustrates how driving forces (blue) can only increase over time (as snow melts) whereas the ice cover resistance (grey), initially much higher, declines under the increasing power of the spring sun.
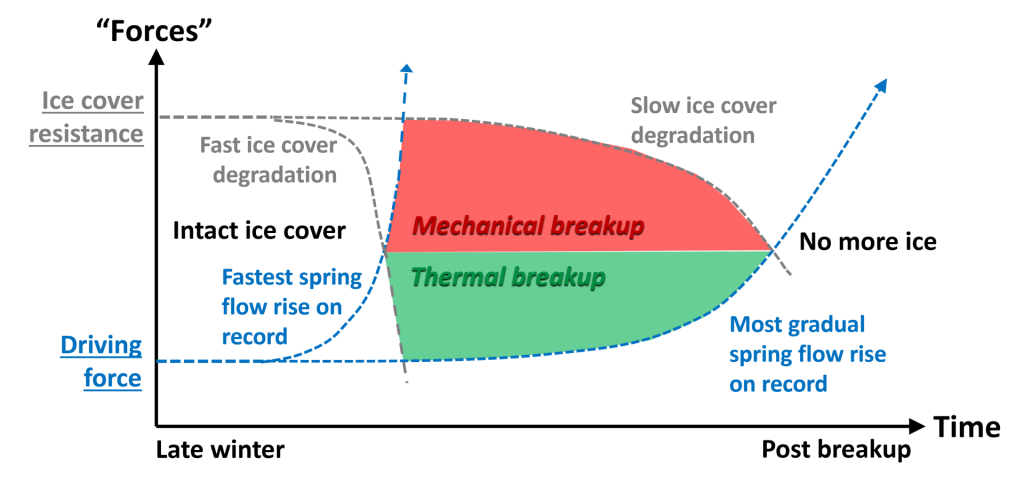
Most river ice scientists consider that river ice breakup is either thermal (controlled by a significant degradation of the ice cover) or mechanical (driven by a fast-rising flow). Large ice jams that cause floods (with water level rising at impressive rates) are mostly associated with the mechanical (or dynamic) type of scenarios, those characterized by significant forces and energy (see figure below). Why? Because large ice jams store a significant amount of ice and water, and this represents energy retrieved from the river system and stored as potential energy (just like hydroelectric dams store water for energy production). The capacity of a river segment to hold this ice and water in place means that the downstream ice support must be very resistant, more than the upstream weight of the ice and water pushing against it. In thermal breakup years, the ice degrades (loses its structural integrity) and melts, just like the ice on a lake, while the river flow remains low. This is usually associated with weak ice jams that cannot generate overbank flooding.
Adding a layer of complexity
Here, it is considered that purely mechanical or thermal scenarios represent two extremes between which a range of possible breakup intensities exist. This leads to a more complex figure, especially if it is considered that a range of flow and ice cover resistance (correlated here with the local ice thickness) exist at the end of any given winter.
There are several important points to make about this figure:
- The adopted colour scheme, from red to green, can be associated with the level of consequence (or intensity) of different breakup scenarios, which is useful from an emergency preparedness and management perspective.
- The shape of the coloured area (defined by the timing and intensity of historical breakup scenarios) is unique to any river segment (even over a short river distance). Graphs associated with different river segments could range from almost entirely green (mainly affected by thermal breakups) to mostly red and yellow (dominant ice jam locations).
- For any river, the ice must degrade (lose its structural integrity) at a minimal rate during the spring (represented by the upper boundary of the coloured area). Ice degradation is driven by the energy from solar radiation. For example, each square meter of river surface at Dawson is exposed to 5.5 kilowatt-hour (kWh) of solar radiation over 24 hours on April 1, a value that rises to 10.0 kWh on May 15.
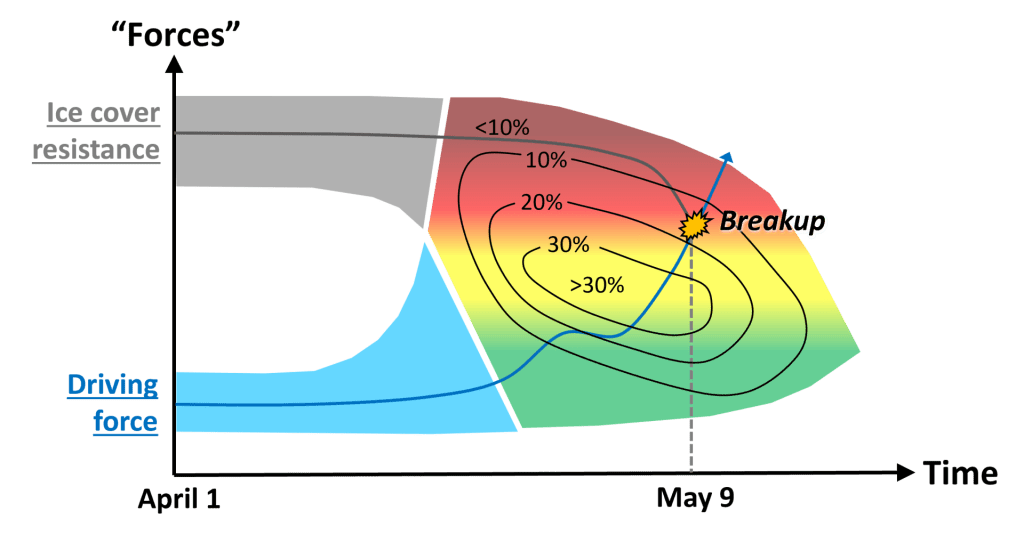
Back to the initial question: Should we be worried about a delayed spring? Based on the figure above, this is actually the opposite (the right end of the graph is mostly green). But there is one caveat: the probability of seeing spring breakup happen at any given time and intensity within the coloured area is not uniform (the area is in fact only a theoretical range of possible scenarios). The figure below includes an example of a breakup scenario (a rising driving force and declining ice cover resistance over time, which intersection represents breakup) in a hypothetical probabilistic breakup field. The breakup event taking place on May 9 is associated with an annual probability of about 15% and would be moderately intense.
At the moment, the probability of different river ice breakup scenarios and the shape of the coloured area is unknown for most river segments (or communities) of the Yukon; therefore, the official answer to the initial question cannot be known with certainty. Science-based speculation could provide a defendable answer.
Breakup forecasting
The preceding graphs represent a possible avenue for the development of models that forecast the timing and intensity of river ice breakup. However, it is quite challenging to precisely quantify the forces involved in river ice breakup. For instance, it is unsafe to collect ice samples prior to breakup to determine the structural integrity of the ice cover, it is almost impossible to quantify the ice-bank resistance, and it is difficult to estimate the evolving driving force associated with snowmelt runoff. Therefore, this type of model needs to be framed around accessible indicators (e.g., ice thickness and visual degradation state), which means that it would remain empirical. This explains the use of quotation marks for “Forces” or the use of “Force indicators” on the vertical axis of the graphs.
Developing these models depends on a profound understanding of the factors affecting river ice breakup. This includes weather conditions, starting in the fall and ending with the short term forecast in the spring (for what it is worth). It also implies an interpretation of breakup from a spatial perspective, extending far upstream of a site of interest (this is where the driving force builds up) to some distance downstream (this is where the ice cover may resist and cause an ice jam).
Weather conditions contributing to generating and maintaining a strong ice cover prior to breakup are:
- A high flow prior to winter (this usually generates areas of thick, resistant ice cover, known as freeze-up jams or consolidation locations)
- A relatively dry mid-winter (this prevents the ice cover from being insulated from cold air by a thick snow cover)
- A cold winter (this maximizes heat loss and ice cover thickening)
- Late season snow (the ice cover cannot feel the solar radiation when covered with a fresh blanket of highly reflective snow)
- Cloudy conditions during the day (for a given air temperature, the ice cover degrades faster under a bright sun than under an overcast sky)
The conditions that lead to a fast-rising flow:
- A relatively thick snow cover (although not all the snowmelt runoff contributes to breakup, so there is a threshold above which more snow does not significantly contribute to the early spring runoff)
- Several thaw-freeze cycles (the entire snowpack needs to warm to 0°C on a wide range of altitudes before it starts to melt)
- A sudden, prolonged rise in air temperatures with no freezing at night and/or an intense rain (the latter is not common during the Yukon spring, but it is potentially likely to occur more frequently in a changing climate)
- The release of a large, upstream ice jam (the wave and associated ice run represent a lot of power). This is usually triggered by the above listed weather conditions.
For the opposite, lower energy/thermal scenario, the conditions that prevent ice jam floods from happening, regardless of previous winter conditions, are:
- Dry, cool conditions (no rain, only bright sunshine)
- Thaw-freeze cycles persisting well after the snowpack becomes isothermal (snowmelt will stop at night in all small tributaries, and the cumulative runoff will be limited)
- A couple of warm days followed by a couple of colder days (this prevents any breakup momentum to build up)
The YukonU Research Centre – Climate Change Research – Hydrology Team has initiated a one-year project with the Water Resources Branch of the Government of Yukon to support the development of river ice breakup tools that will ultimately support flood forecasting. These innovative tools will build on the most recent science available about river ice breakup.
2023 breakup outlook for Dawson (as of April 25, 2023)
The snowpack is currently well-above average in several areas of the Territory (see the Yukon Government Snow Bulletin for the month of April) and the river ice formation process in the fall was unusually intense upstream of some flood-prone locations. The flow has not started to rise yet in most river systems, but recent snowfalls have prevented the ice cover from degrading, so its late-winter strength is essentially unchanged. This means that pretty much the full range of river ice breakup intensities remain possible.
A significant warm weather anomaly lasting 2 to 4 days within the next 10 days would be enough to trigger high intensity breakup in smaller river systems such as the Tr’ondëk (Klondike River). For larger systems like the Tágà Shäw (Yukon River), a longer, widespread period of warm or rainy weather would be needed to cause a fast-rising discharge that would result in intense ice jamming.
Is climate change bringing less ice jam problems?
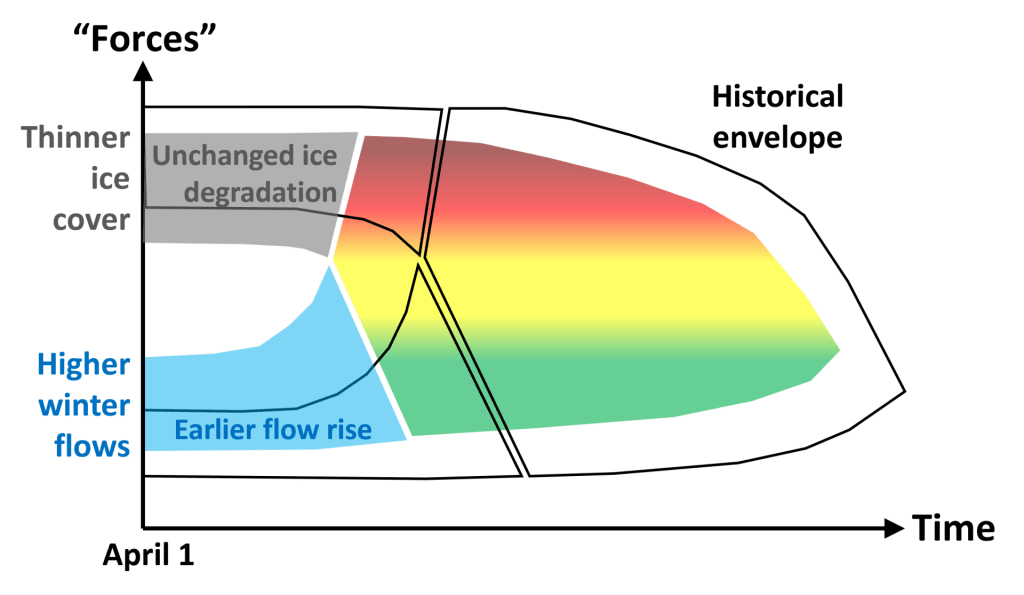
Climate change will alter the shape of the coloured breakup area as well as the probability of different breakup scenarios as defined in the graph above. The following changes could happen in some river systems (see graph below):
- Warmer winters will tend to reduce the maximum strength of the ice cover prior to breakup, shifting the entire coloured area down and potentially reducing the dark red area associated with highly mechanical breakup scenarios.
- Higher winter flows will also shift the lower portion of the coloured area, but the impact of this change on the extent of the green area is uncertain.
- As a result of the smaller difference between driving and resisting forces at the end of winter, breakup could happen sooner during the spring season. However, the fact that the sun angle is not affected by climate change means that the ice will not likely degrade much faster in the future. Therefore, mechanical river ice breakup scenarios will remain possible.
The sun plays a dominant role in breakup scenarios in northern Canada, and this may explain why river ice breakup dates in Yukon have not significantly evolved in the last century despite a clearly warming climate.
Are there any historical ice jam flood trends that can inform us about the changing intensity of breakup in Yukon? This paper suggests that, generally, not enough historical data exists whereas this other paper proposes that breakup may become more intense on the Porcupine River at Old Crow. Significant ice jams have affected the communities of Fort McMurray, Fort Simpson, and Hay River in recent years. Yukon has been spared… so far.
***
This has been a very technical, but hopefully interesting blog post. Based on what is explained above, would you be able to explain why we generally associate mechanical breakup events with rivers that are flowing north?