For years now, we have been witnessing the occurrence of weather extremes. In 2021, unprecedented hot weather, droughts, and floods affected different regions of Canada, including Yukon. A couple of years before, in the spring of 2019, a very thin snowpack was reported in central and southern Yukon. This spring, several areas of Yukon have set new precipitation records (since monitoring started between the 1960s to the 1990s) and the snowpack in a majority of Yukon watersheds is concerning (refer to the Yukon Government April 1st Snow Bulletin for detail). This means that the amount of water in most streams, rivers, and lakes will be substantial in months to come, regardless of weather conditions.
Does a thick snowpack always translate into snowmelt-driven floods?
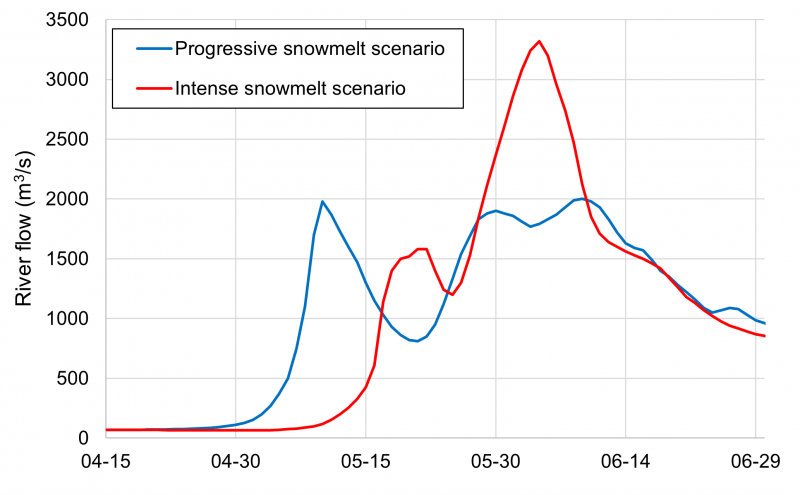
Generally, a significant snow water equivalent (SWE, in millimeters, a more meaningful hydrological indicator than snow depth) corresponds to a higher probability of flooding, but it does not directly imply an impending flood. The following figure presents two different hydrographs (flow as a function of time) associated with the melting of a higher-than-average snowpack. A progressive melt (blue) leads to three runoff events with flows reaching 2000 m3/s, well-below the flood threshold of 3000 m3/s. For a similar volume of water from April to June, the other scenario (red) presents a delayed and intense snowmelt. In this case the peak flow reaches 3300 m3/s, causing a minor flood.
Now, considering the April 2022 snowpack reported in most watersheds of Yukon, combined with early April snowfalls and an overall delayed melting period, the situation is far from ideal (for various communities, mining sites, and highways). In some watersheds, flooding could only be avoided if a very specific sequence of weather conditions takes place:
- Ice jam floods are usually caused by the sudden mobilization of a resistant ice cover by a fast-rising flow. To avoid this type of flood, daily freeze-thaw cycles and sunny conditions are needed for at least a couple of weeks sarting in late-April (central Yukon) to early-May (north) in order to weaken the ice cover (ice crystals separation) while limiting snowmelt rates. Cold conditions, snowfalls, and overcast skies are not welcomed because they tend to delay ice cover degradation. If the ice cover is largely intact when sudden and persistent warm conditions or rainfalls occur, resulting high flows will trigger the formation of intense ice jams.
- Open water floods in rivers of Yukon are mainly caused by high snowmelt rates across many different elevations simultaneously (from valley bottoms to mountain tops) between mid-May and mid-June, or by rain-on-snow events during the same period. In the presence of a record snowpack, a progressive transition from spring to summer conditions may lead to a situation where too much snow persists into the warmest periods. Therefore, what is really needed to avoid flooding is a maximized snowmelt rate as soon as possible in the spring (after breakup, and without any rain) to evacuate as much water as possible from each watershed while remaining below flood thresholds. The alternance of warm and cold weather is also welcomed as it contributes in breaking the snowmelt wave into multiple smaller waves (just like in the blue data set presented in the graph above). For a large lake system like Deisleen Kwáan (Teslin Lake), in addition to dry conditions, an entire week of cool weather in early June would be more than welcomed.
Challenge associated with flood forecasting
People often assume that experienced hydrologists having access to tools and models should be able to forecast a flood well in advance. However, in Yukon, some factors prevent an accurate forecast from being made. Weather models are often imprecise or inaccurate (owing, in part, to the limited weather observation network). In addition, hydrologists rarely have access to extensive data about the amount of snow on the ground, received precipitation, and ground saturation.
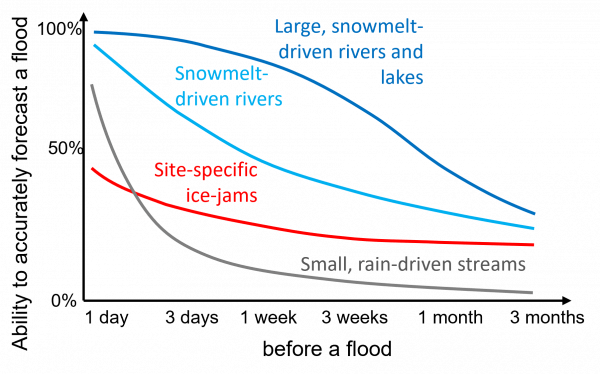
The figure below schematizes the ability to accurately forecast different floods expressed as a function of the lead time before the event. For example, a spring breakup ice jam in the Tr’ondëk (Klondike River) partially depends on ice formation processes that have taken place many months ago, but the process is ultimately dictated by factors that materialize only a few days before the ice jam flood occurs, and even then, a large uncertainty remains (red). For a large water body like Deisleen Kwáan (Teslin Lake) or the Marsh-Tagish-Bennett Lake system (dark blue), a very wet fall and/or a significant early-winter snowpack already suggest that water levels next summer can only be above average. Then, because these water bodies react progressively to tributaries input, there are signs that something will go wrong more than a week before water levels start affecting residents. For small streams (grey) that mostly react to rain events, the flood forecasting skill essentially depends on short term weather forecasts as well as on looking at the rain intensity as it falls on your roof. Finally, forecasting open water floods for mid-size rivers (light blue) like the Ts’ekínyäk Chú (Pelly River), Nä`chòo ndek (Stewart River), and Nêtʼił Tué’ (Liard River) generally represents an average challenge.
The YukonU Research Centre does not produce seasonal and short-term flood forecasts. However, explaining natural processes and developing tools that support flood risk reduction efforts align with our research mission.
Exploring Southern Lakes hydrology
In 2021, Yukoners living in the Whitehorse – Carcross – Tagish area could confirm that a thick spring snowpack can lead to flooding during the following months. Considering that there is as much snow this year around Southern Lakes, there is certainly room for concern. Yukon Energy Corporation has acted to lower lake levels as much as possible by the end of winter, and this will certainly give more room to hold the snowmelt water to come. The fact that there is globally less Snow Water Equivalent (SWE) in the Southern Lakes watershed than last year is also encouraging.
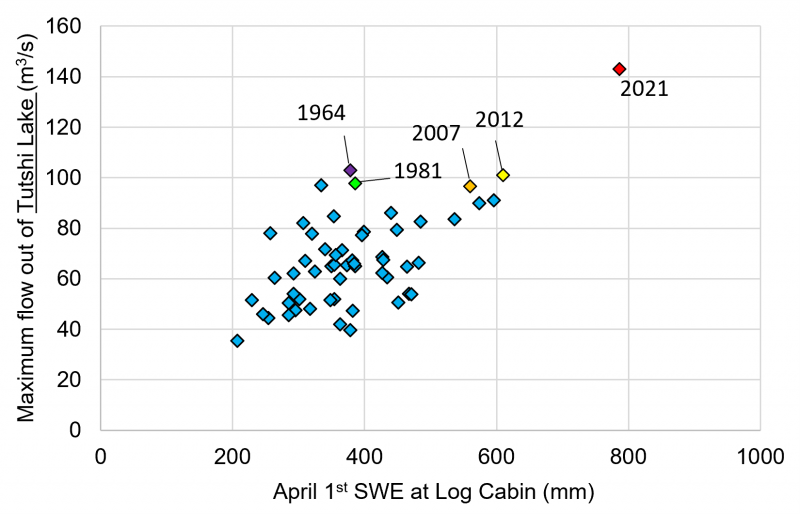
Many variables influence maximum summer water levels in Southern Lakes. If we look at two variables influencing lake inflows (water entering the lake), we can see some degree of correlation between the maximum flow from Tutshi River and the April 1 SWE at Log Cabin. The Tutshi watershed only represents 6% of the Yukon River headwaters, but its hydrological regime is representative of a larger area (from Tagish Lake to Bennett Lake). The following figure presents data from 1960 to 2021 and reveals that the highest Tutshi River flows are generally associated with the most significant snowpack. Years 1964 and 1981 are probably extreme runoff scenarios in the presence of an average snowpack.
The correlation seems to fade when expressing the maximum natural* water surface elevation in Marsh Lake** as a function of the same April 1 SWE at Log Cabin (see following graph). In this case, many factors add “noise” to this relationship, including the spatial snowpack variability in the entire watershed, the rate at which the snow melts, the occurrence of rain events, and the contribution of glacier melt (this begins later in the summer). There are years (e.g., 2012) when Marsh Lake water levels were not alarmingly high despite a significant snowpack at Log Cabin.
* The maximum natural water surface elevation (or water level) means that any late-season maximum water level that would have been caused by Lewes Dam operations was excluded from the data set (this apparently took place during 15 falls since 1968 and water levels remained below 656.7 m).
** This elevation is expressed relatively to sea level and uses the old datum correction (CANADIAN GEODETIC VERTICAL CGVD28) provided by the Water Survey of Canada for station 09AB004.
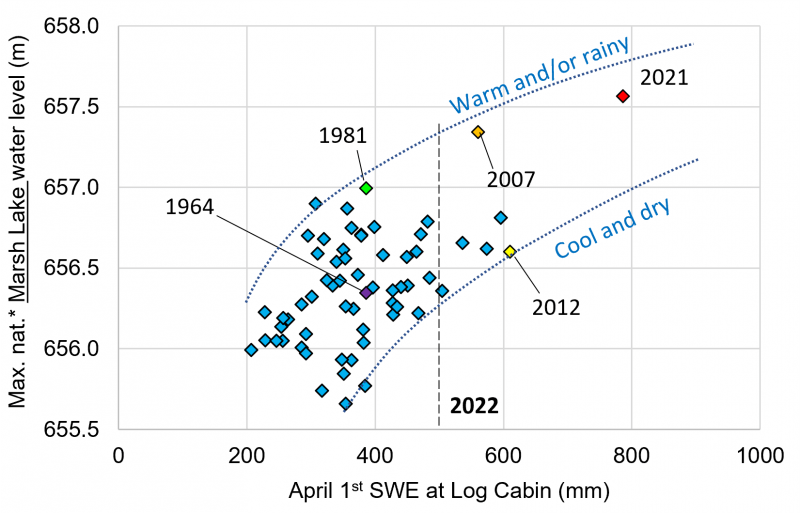
Despite a low correlation, the relationship between Marsh Lake maximum water levels and the April 1 SWE at Log Cabin does not defy logic, with the 2007 and 2021 floods associated with high snowpacks. We can assume that, for average spring snowpack conditions at Log Cabin (a SWE of about 380 mm), nature has demonstrated the full range of potential maximum water levels in Marsh Lake (generally between 655.8 m and 656.8 m). If we extend hypothetical (but scientifically defendable) upper and lower boundaries, respectively defining warm/rainy summers and cool/dry summers, and considering the April 1, 2022, SWE at Log Cabin (485 mm), it can be argued that maximum water levels in Southern Lakes next summer will be high (656.4 m to 657.3 m), but should remain below the 2007 and 2021 levels. If these boundaries proved to be realistic (more research needed), this would support the hypothesis that 2021 water levels could have been higher (the worst-case summer weather scenario did not materialize for that 2021 substantial SWE).
Exploring relationships between snowpack conditions, lake inflows, and lake outflows represent pieces of an alternate approach to classic hydrological models for predicting water levels in Southern Lakes. This “more direct” approach would heavily rely on hydrometric stations.
Climate change and Southern Lake floods
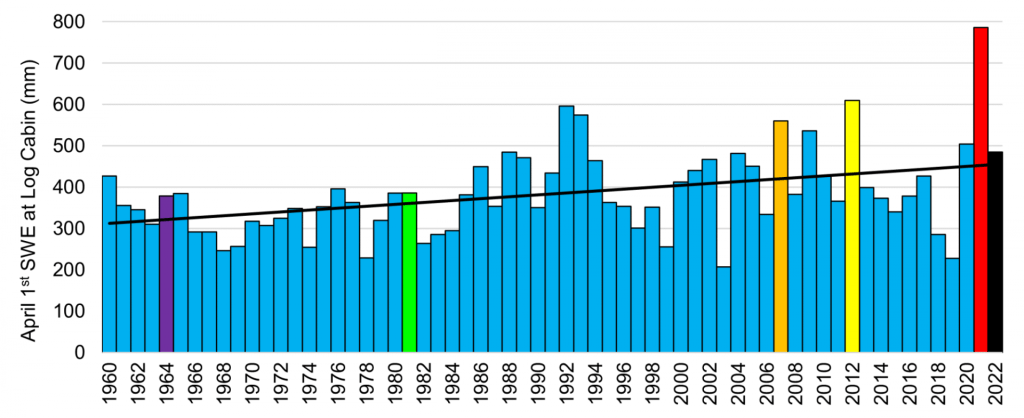
The Snow Water Equivalent (SWE) at Log Cabin is a fair indicator of maximum water levels in Southern Lakes. The following figure shows that this parameter has been rising over the years, with recent dry and wet extremes. This rising trend and increasing variability are consistent with climate model projections for the region.
In terms of maximum water surface elevation in Southern Lakes, a frequency analysis was performed using a 40-year window starting in 1990 (1950-1990) and ending in 2021 (1981-2021). The following figure reveals that the 2-year level (associated with an annual probability of 50%) has remained statistically constant over time at about 656.7 m. In turn, the 20-year water level (5%) and the 200-year water level (0.5%) respectively rose by 25 cm and 50 cm, mainly because of the 2007 and 2021 floods. This means that a flood map produced in the 1990s would be largely outdated and not suitable for development planning. These results also align with the expected impact of climate change on Southern Lakes inflows.
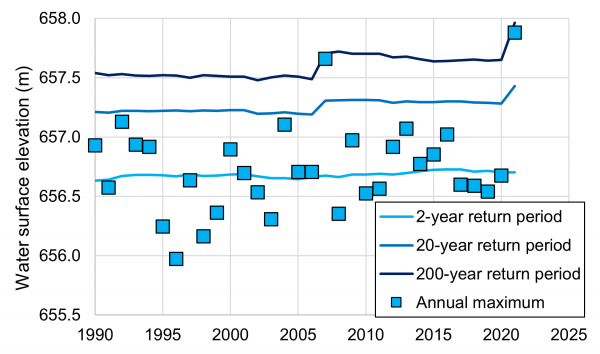
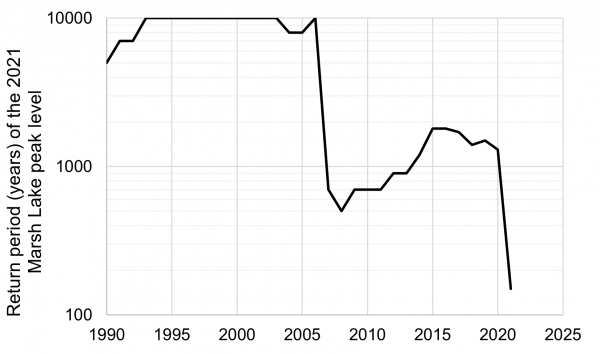
This last figure presents a data set derived from the same analysis. In 1995, a water surface elevation corresponding to 657.8 m (the 2021 Marsh Lake flood) was associated with a return period of more than 10,000 years (an event that we could hardly imagine). Now, after the 2021 event itself, the return period associated with a similar event is down to 150 years (annual probability of 0.7%). If carbon emissions are not reduced, the 2021 flood could become a “normal extreme”.
