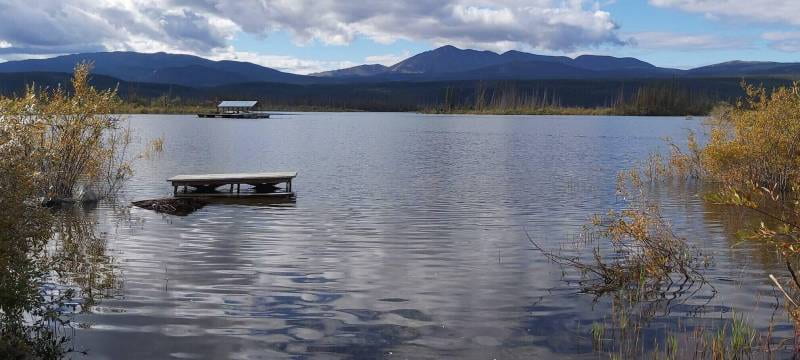
Water levels in the Marsh-Tagish-Bennett Lakes system peaked on August 27 at a level that is only 0.6 m lower than in 2021 and 0.4 m lower than during the flood of 2007. More specifically, 2022 is only a few millimeters below the 3rd highest level on record since 1970. Also of interest is that Áa Tlein (Atlin Lake; Atlin River is the largest tributary of Tagish Lake) peaked at a level that compares with those of 2021 and 2007.
How are these high-water events comparable and what does this tell us about the future?
A question of water balance
Let’s first look at how Southern Lakes work. Two major processes control their water levels:
- Water outputs at the outlet of Marsh Lake
- Water inputs in the form of snowmelt, glacier melt, and rain runoff
The output, or the capacity of Marsh Lake’s outlet, is largely determined by the water level of the Lake itself (when all gates at Lewes Dam are open). When Marsh Lake is very low (at the end of winter), only some 100 cubic meters per second (m3/s, a streamflow unit) of water may flow towards Whitehorse. In turn, when the Lake is very high (like in July 2021), almost 800 m3/s can be evacuated through Lewes Dam. In other words, and this is a paradox, if you want Southern Lakes to empty faster, you must wait for their water level to be high.
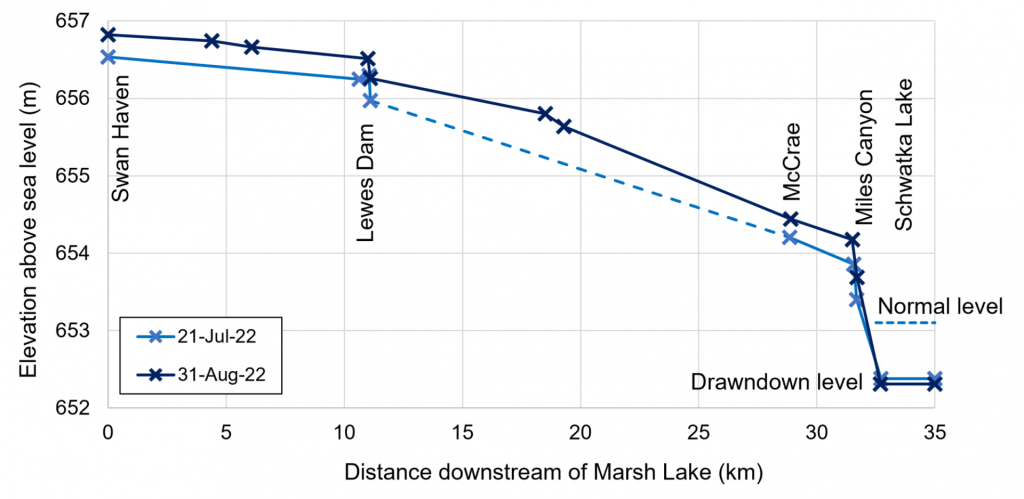
But is there any operation that could help Marsh Lake’s outlet evacuate more water for a given level? The short answer is “Hardly”. The figure below suggests that the water surface profile (elevation over the distance) of the Yukon River from Marsh Lake to Schwatka Lake is mostly controlled by Kwanlin (Miles Canyon) and by the general shape of the 30-km long river channel. Lewes Dam and the Whitehorse Rapids Dam (Schwatka Lake) play a lesser role. During the summers of 2021 and 2022, the Yukon Energy Corporation (YEC) reduced water levels in Schwatka Lake in order to “call” more water from Marsh Lake through Miles Canyon – basically slightly increasing the river slope along the river.
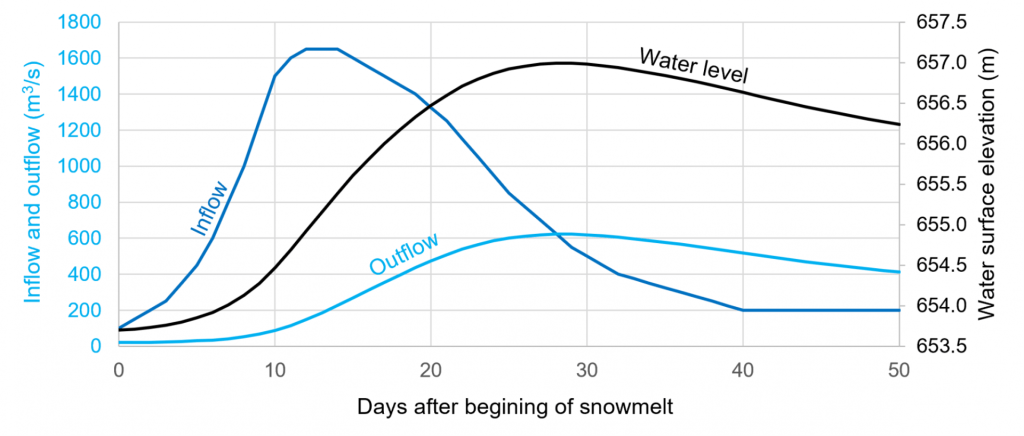
The reason why water levels in Southern Lakes can rise fast in early-summer (as much as 0.2 m/day) is that, while the outlet is releasing some 200 m3/s, water supplies could be as high as 2000 m3/s. The water supply is the sum of the flow from all streams and rivers feeding into Bennett, Tagish, and Marsh Lakes (it includes flow from Atlin River). For example, at some point in 2021, Tutshi River (from T’ooch’ Áayi [Tutshi Lake], a watershed representing about 5% of all Southern Lakes catchment) was supplying 140 m3/s to Tagish Lake. If the flow from all other tributaries would have been proportionally equal, this would have represented 2800 m3/s of total Southern Lakes inflow (translating into an initial water level rise of 0.4 m in one day). Fortunately, the various landscapes of the Southern Lakes watershed (valleys, wetlands, high-mountains with their south-facing and north-facing sides, glaciers, etc.) respond to weather conditions with different timing and intensity.
Maximum water levels in a lake are reached when rising outflows finally catch up with inflows. Ideally, this point is reached before inconvenience occur, but 2021 and 2022 are recent examples of an equilibrium reached after significant cumulative inputs, a result of the above-average snowpack in Southwestern Yukon.
One key aspect of the Southern Lakes dynamics is that everything is a question of timing: A significant water supply from glacier melt (for example) occurring when lake levels (and outflows) are already high (at the end of summer) does not result in a significant stage rise. On the other hand, a similar inflow caused by mid-elevation snowmelt in early June, when lake outflows are low, will cause a noticeable rise. Similarly, 30 mm of rain falling in the entire watershed will generate a greater rise if water levels are low.
It is fairly easy to build a model that simulates water levels in Southern Lakes based on estimated (and forecasted) inflows and calculated outflows (see hypothetical example below). However, estimating or forecasting inflows (runoff) can be challenging (hydrological forecasts can only be as good as weather forecasts).
Historical floods
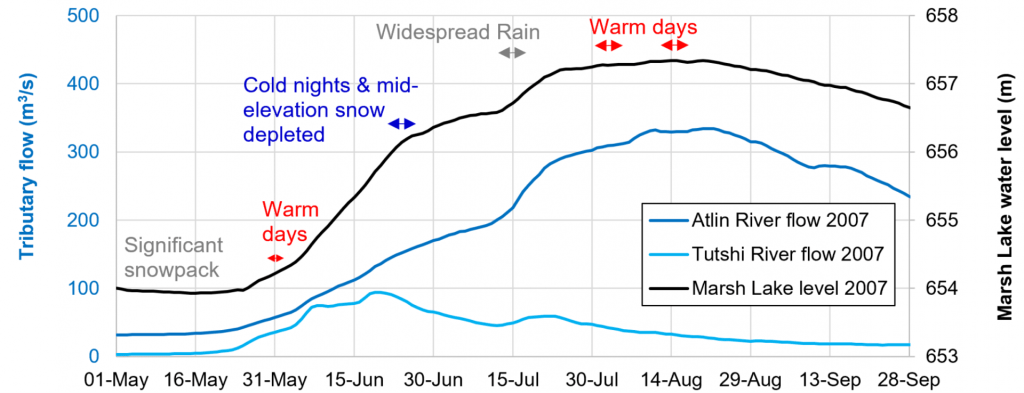
The left axis of the graph below shows how two measured Southern Lakes inflows (Altin River and Tutshi River, representing a total of 40% of the Southern Lakes watershed) reacted to weather conditions during the summer of 2007. The right axis reveals how Marsh Lake levels (black line) responded. Tutshi Lake drains the White Pass, and this includes a small glacier area; therefore, its mid-elevation snowmelt supply is often depleted by end of June (and this is also representative of several Bennett Lake tributaries). In turn, Atlin Lake includes higher mountains and is largely fed by glacier rivers (just like Tagish Lake) and therefore continues to react to late-summer weather patterns. This graph indicates that without the widespread rain of mid-July 2007, water levels in Southern Lakes could have stabilized at a lower level (probably just above 657 m, based on the old Water Survey of Canada datum).
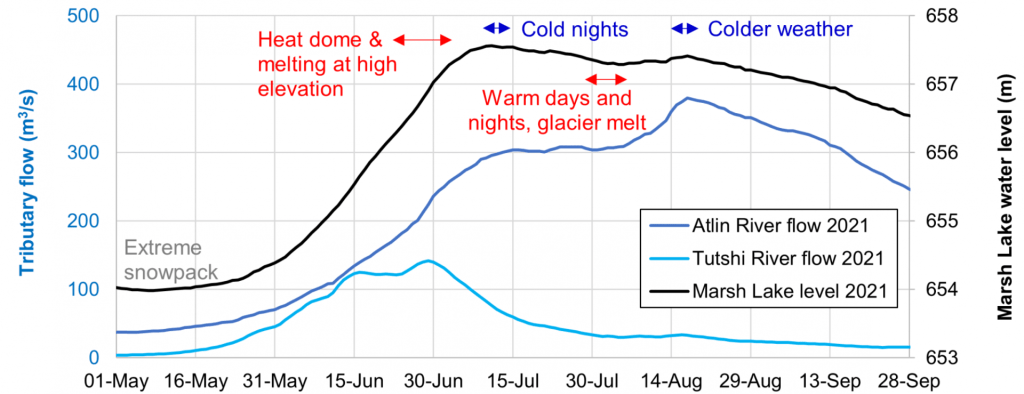
The scenario was different in 2021 (graph below). The melting rate of the extremely thick snowpack was reasonable until the last third of June. When the northern extension of the (now-famous) heat dome affected Southern Yukon, it triggered a simultaneous melt of the mid and high-elevation snowpacks and the Southern Lakes continued to rise at an alarming rate despite progressively increasing outflows. Without these warm conditions, water levels would have remained below the 2007 peak. However, a longer heat dome would have generated slightly higher water levels and potentially more damage. Interestingly, the next (early August) warm spell did not generate a higher peak because of the significant Marsh Lake outflow (order of 900 m3/s). Altin Lake peaked some 40 days after Marsh Lake, a scenario that significantly differs from 2007 (and 2022 presented after). Cold weather in mid-August abruptly ended glacier melting.
Now, in 2022, the scenario is more comparable to what happened in 2007. The late-winter snowpack (with some residual high-altitude snow from 2021) was well-above average and water levels in Southern Lakes reached a plateau in mid-July (imposed by cooler-than-normal weather conditions). Interestingly, there was a time in June when the Tutshi River was carrying more flow than the Atlin River despite a watershed seven times smaller (this translates the difference in the average elevation, mountain faces orientation, and glacier coverage of these watersheds). The gradual rise in water levels during the month of August was caused by rain events combined with relatively warm air temperatures. Without cooler mid-summer conditions, water levels could have been higher in Southern Lakes.
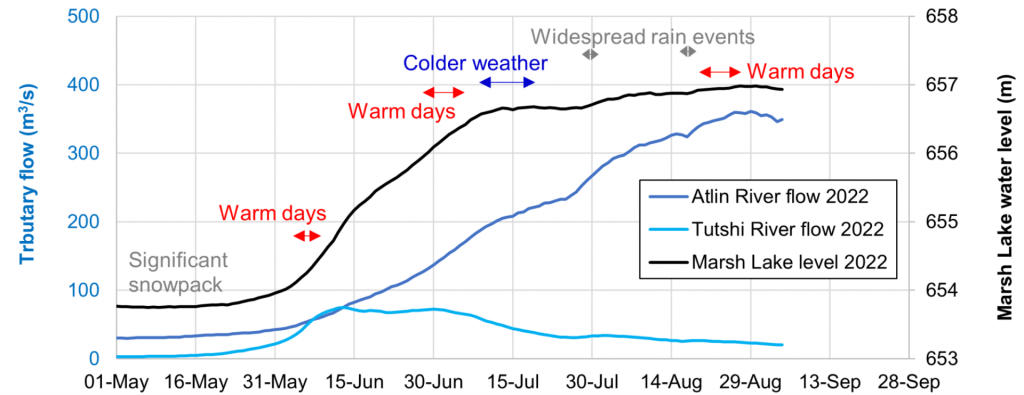
Some readers may have noticed that the water level in Marsh Lake on May 1st, 2022, was lower than on May 1st, 2007 and 2021, by about 0.25 m. It roughly represents an additional volume of 140 million m3 of water that could be stored in Southern Lakes during the melt season. Does this mean that peak water levels would have been 0.25 m higher without this additional storage capacity? Not exactly, if we follow the logic explained above: the evacuation capacity of Marsh Lake at the beginning of the summer is marginal. In fact, this additional space in early summer probably reduced the summer peak by about 0.1 m, which is still a positive outcome.
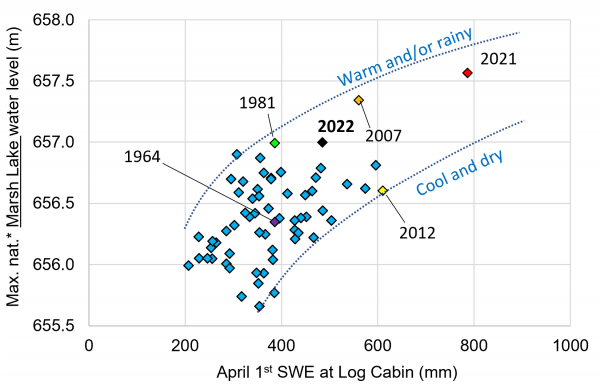
The following figure is updated from a previous blog post and shows how water levels in Marsh Lake have reached the high (warm and/or rainy) side of their possible summer range, based on the late-winter snowpack measured at Log Cabin.
Perspective
Peak water levels in 2007, 2021, and 2022 have one thing in common: a higher-than-average late-winter snowpack. This represents a dominant ingredient of the flood recipe, and unfortunately, climate change should bring, on average, more winter precipitation to the Southern Lakes watershed. Other ingredients that are also influenced by climate change include heat waves and summer rainstorms. Significant heat played a role in 2021 and rain played a major role in 2007. In 2022, a combination of moderate heat and rain caused the high-water scenario.
Glacier-fed rivers are currently the most impacted by climate change in Yukon. The headwaters of the Yukon River (Southern Lakes) are significantly impacted because a wide range of climate change-induced weather patterns and extremes lead to high water levels… and floods. Even after the dry winter of 2019, Southern Lakes did fill up to their full supply level, probably because of glacier contribution.
The worst-case flood scenario for Southern Lakes (see upper line in the graph above) would be a 2021 snowpack, and a longer and more intense 2021 heat dome followed by 2007 mid-summer widespread rainstorms. A recent statistical assessment suggests that the 2021 flood may be associated with a return period of only 50 years (as opposed to a return period of more than 10,000 years prior to 2007), in a context where global warming cannot be easily stopped.
Yukon will be affected by weather and hydrological extremes in years to come. Flood and drought adaptation has never been more urgent.